21 Apr How Developers Can Use USCIS Processing Statistics
Developers have increasingly looked to the EB-5 program as a less expensive, easier to obtain source of capital over traditional financing. However, lengthy I-526 processing times present a challenge to developers with shovel-ready projects. In many EB-5 deals, investors’ funds are placed in escrow until the investors’ I-526s petitions are approved, which can take well over a year. To address the significant gap in project financing schedules, developers typically turn to interim financing measures, such as bridge loans or early-release subscription agreements with their investors.
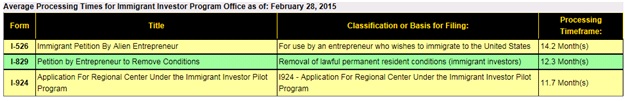
Planning for interim financing is a crucial step in the EB-5 process. Information about I-526 processing times can help developers plan their financing strategies. Fortunately, USCIS publishes easy-to-read processing data on I-526 and I-829 petitions. For example, below is the most current chart from the USCIS website representing processing times:
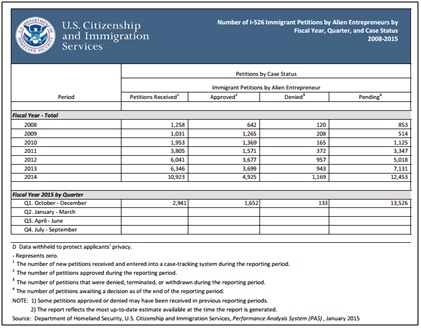
In addition, USCIS regularly publishes reports on the number of petitions received, approved, denied and pending. These reports are displayed by fiscal year and are updated by quarter. They can be found here for I-526 petitions and here for petitions. The most current data posted on the USCIS web site is for Q1 FY2015.
Performance and processing-time data allow us to identify some interesting trends, such as:
- There has been a drop in the number of I-526 petitions submitted to USCIS. The gray line in the chart below illustrates the number of petitions received by USCIS. The decrease started in Q4 2014 and continued into Q1 2015. It is the first decrease in I-526 petitions in over a year. This may be the result of the bad press the EB-5 Regional Center program has received lately due to a rise in fraudulent activity, as reported on our blog, anticipated Chinese retrogression or the September 30, 2015 sunset of the current 3-year term of the Regional Center program.
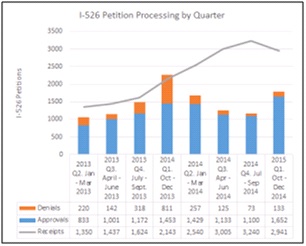
Data Source: USCIS
- The number of I-526 petition denials has almost doubled (from 73 in Q4 2014 to 133 in Q1 2015), while the number of approvals has increased by about 50% (from 1,100 in Q4 2014 to 1,652 in Q1 2015).
- The number of I-526 petitions processed by USCIS has increased by almost 42% (from 1,258 in Q4 2014 to 1,785 in Q1 2015). This may be good news for petitioners awaiting a response from USCIS, provided it continues long term.
- The average processing times for all EB-5 petitions and applications has increased slightly since the previous quarter, as the chart below, illustrates, which means that applicants are waiting longer for a response. This may be a result of the transition of EB-5 case processing from the California Service Center to the Immigrant Investor Program Office in Washington, D.C. early last year.
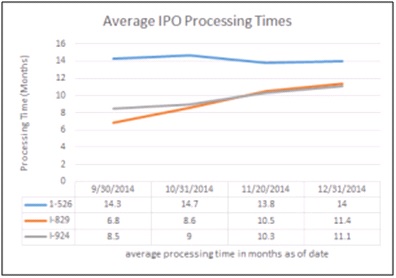
Data Source: USCIS
- The number of pending applications is at a high of 13,526 (up from 514 in 2009) representing a backlog in the system. Even though USCIS processed more petitions in Q1 2015 than Q4 2014, the increase is small compared to cumulative number of applications awaiting processing.
Checking data on the USCIS site is a valuable tool for all parties involved in EB-5.
To inquire about our wide range EB-5 services such as our best-in-class Matter of Ho-compliant business plans, please contact us at info@ecouncilinc.com.
e-Council Inc.’s website, newsletter and other forms of communication contain general information about legal matters. The information is not legal advice and should not be treated as such. You must not rely on the information on this website as an alternative to legal advice from an attorney or other professional legal services provider. For specific questions about any legal matter please consult with an attorney or other professional services provider.